We’ve now moved to dailee.me — redirecting you there now...
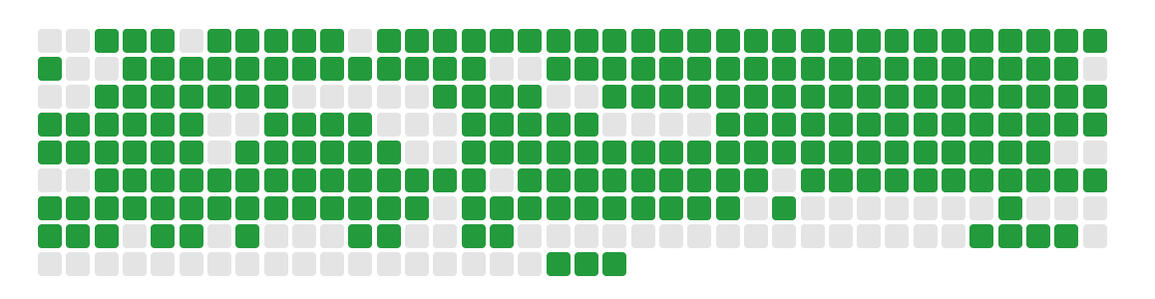
Get a website widget that displays a live graphic of your progress, from data in a Google Sheet
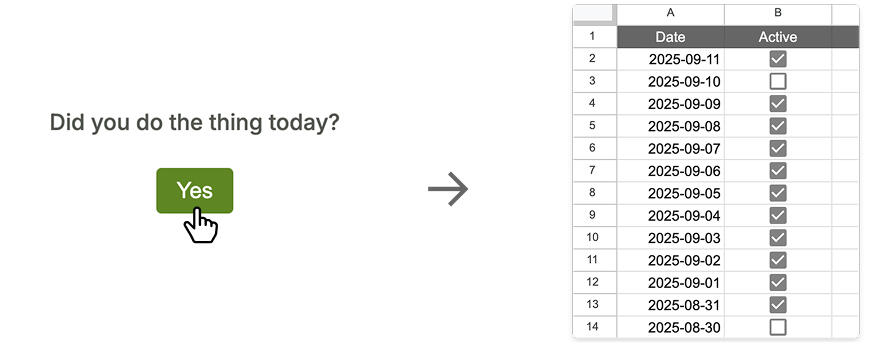
We even have a web button you can deploy, to automatically update your Sheet with one click each day.
◻️◻️◻️◻️◻️◻️
Track daily habits
Exercise
Meditation
Journaling
Reading
Track creative output
Writing
Coding
Shipping
Drawing
Show accountability
Progress reporting
Social posting calendar
Campaign tracking
Safety checks
Show your progress for accountability, or just for some kudos
◻️◻️◻️◻️◻️◻️
Click the button, it automatically updates your Sheet
Which then automatically updates your widget
◻️◻️◻️◻️◻️◻️
①
Set up a Google Sheet & put our log button on a secret web page
②
Connect your Sheet and button to the tracker widget.
③
Embed the tracker widget anywhere with just an iframe.
Add your email to try it or get updates
Current features
Track progress in Sheets, via a web button
Generate a tracker widget iframe embed code (requires a Google API key)
Embed on a website or Notion page
Hover to see dates
Code generators
Tracker iframe
Generate an iframe code. See instructions below.
Log button
Generate the button code. See instructions below.
Set up your Google Sheet
Go to sheets.new
In Column A, put the dates in YYYY-MM-DD format
In Column B, put YES or NO or check boxes to indicate activity
Click Share → Change to Anyone with the link → Viewer to make it publicly readable
Find your Sheet ID – it's the long string between /d/ and /edit in the url
Create a Google Sheets API Key
Go to Google Cloud Console
Create a new project (or select an existing one)
In the left menu, go to APIs & Services → Library
Search for “Google Sheets API” and click Enable
Go to APIs & Services → Credentials → Create Credentials → API Key
Copy the generated API key
Google Sheets API Limits (Free tier):
Requests per day: ~100,000
Requests per 100 seconds per user: ~60
Set up your own logging button
1. Create a Google Apps Script
In your Google Sheet go to Extensions → Apps Script.
Paste in this script, changing NAME for your sheet tab name, (not your Sheets file name):
function doPost(e) {
 const sheet = SpreadsheetApp.getActiveSpreadsheet().getSheetByName("NAME");
 const timestamp = Utilities.formatDate(new Date(), "GMT", "yyyy-MM-dd");
 sheet.insertRowBefore(2);
 sheet.getRange(2, 1, 1, 2).setValues([[timestamp, true]]);
 return ContentService.createTextOutput("Row added successfully");
 }
Click Deploy → New deployment → Web app.
Set Execute as Me and Anyone for access.
Copy the Web App URL it gives.
2. Create your HTML form
Use this HTML where you want to embed the button form (replace YOUR_APP_SCRIPT_URL with your App Script URL):
3. Add the JS logic
Add this script on the same page, before the </body> tag:
4. Test it
Load your page in a browser, and click the Submit button.
Confirm it adds a row to your Sheets file, disables the button for the day, and shows the override checkbox after first submit.